Process Optimization Through Efficient Analyses in the Finance Area
Through maxflow® mining, companies gain detailed insights into business processes, from which relevant information can be filtered out and invoice processes can be optimized in a targeted manner. The prerequisite for using the analysis tool is the use of maxflow® invoice management, our solution for processing incoming invoices, as this serves as the data basis.
- Viewing the volume of documents and document statistics
- Overview of lead time behavior
- Evaluation for discount utilization
- Payment outgoing preview
- Help with the end of the month
- Completely integrated in SAP

The New Invoice KPI Dashboard
In order to provide more transparency and a more modern workplace for processors evaluating invoice processes, we have developed the maxflow® mining dashboard as a tool for process optimization.
The product interface of the dashboard consists of a selection function (e.g. period, document number, etc.) and underlying tiles for the individual evaluations (e.g. cash discount utilization). The respective tiles display context-dependent data based on the selection characteristics entered.

The dashboard is a user-friendly application developed in responsive design based on modern UI5 technology .
By clicking on one of the tiles, the evaluated data is shown in a graphical display and the KPI's can be customized according to individual information needs through the selection mask.
The Following Evaluations Are Currently Available:
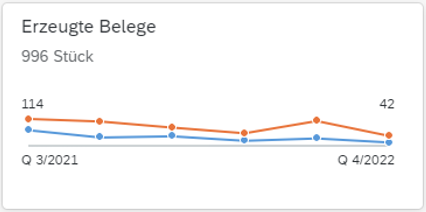
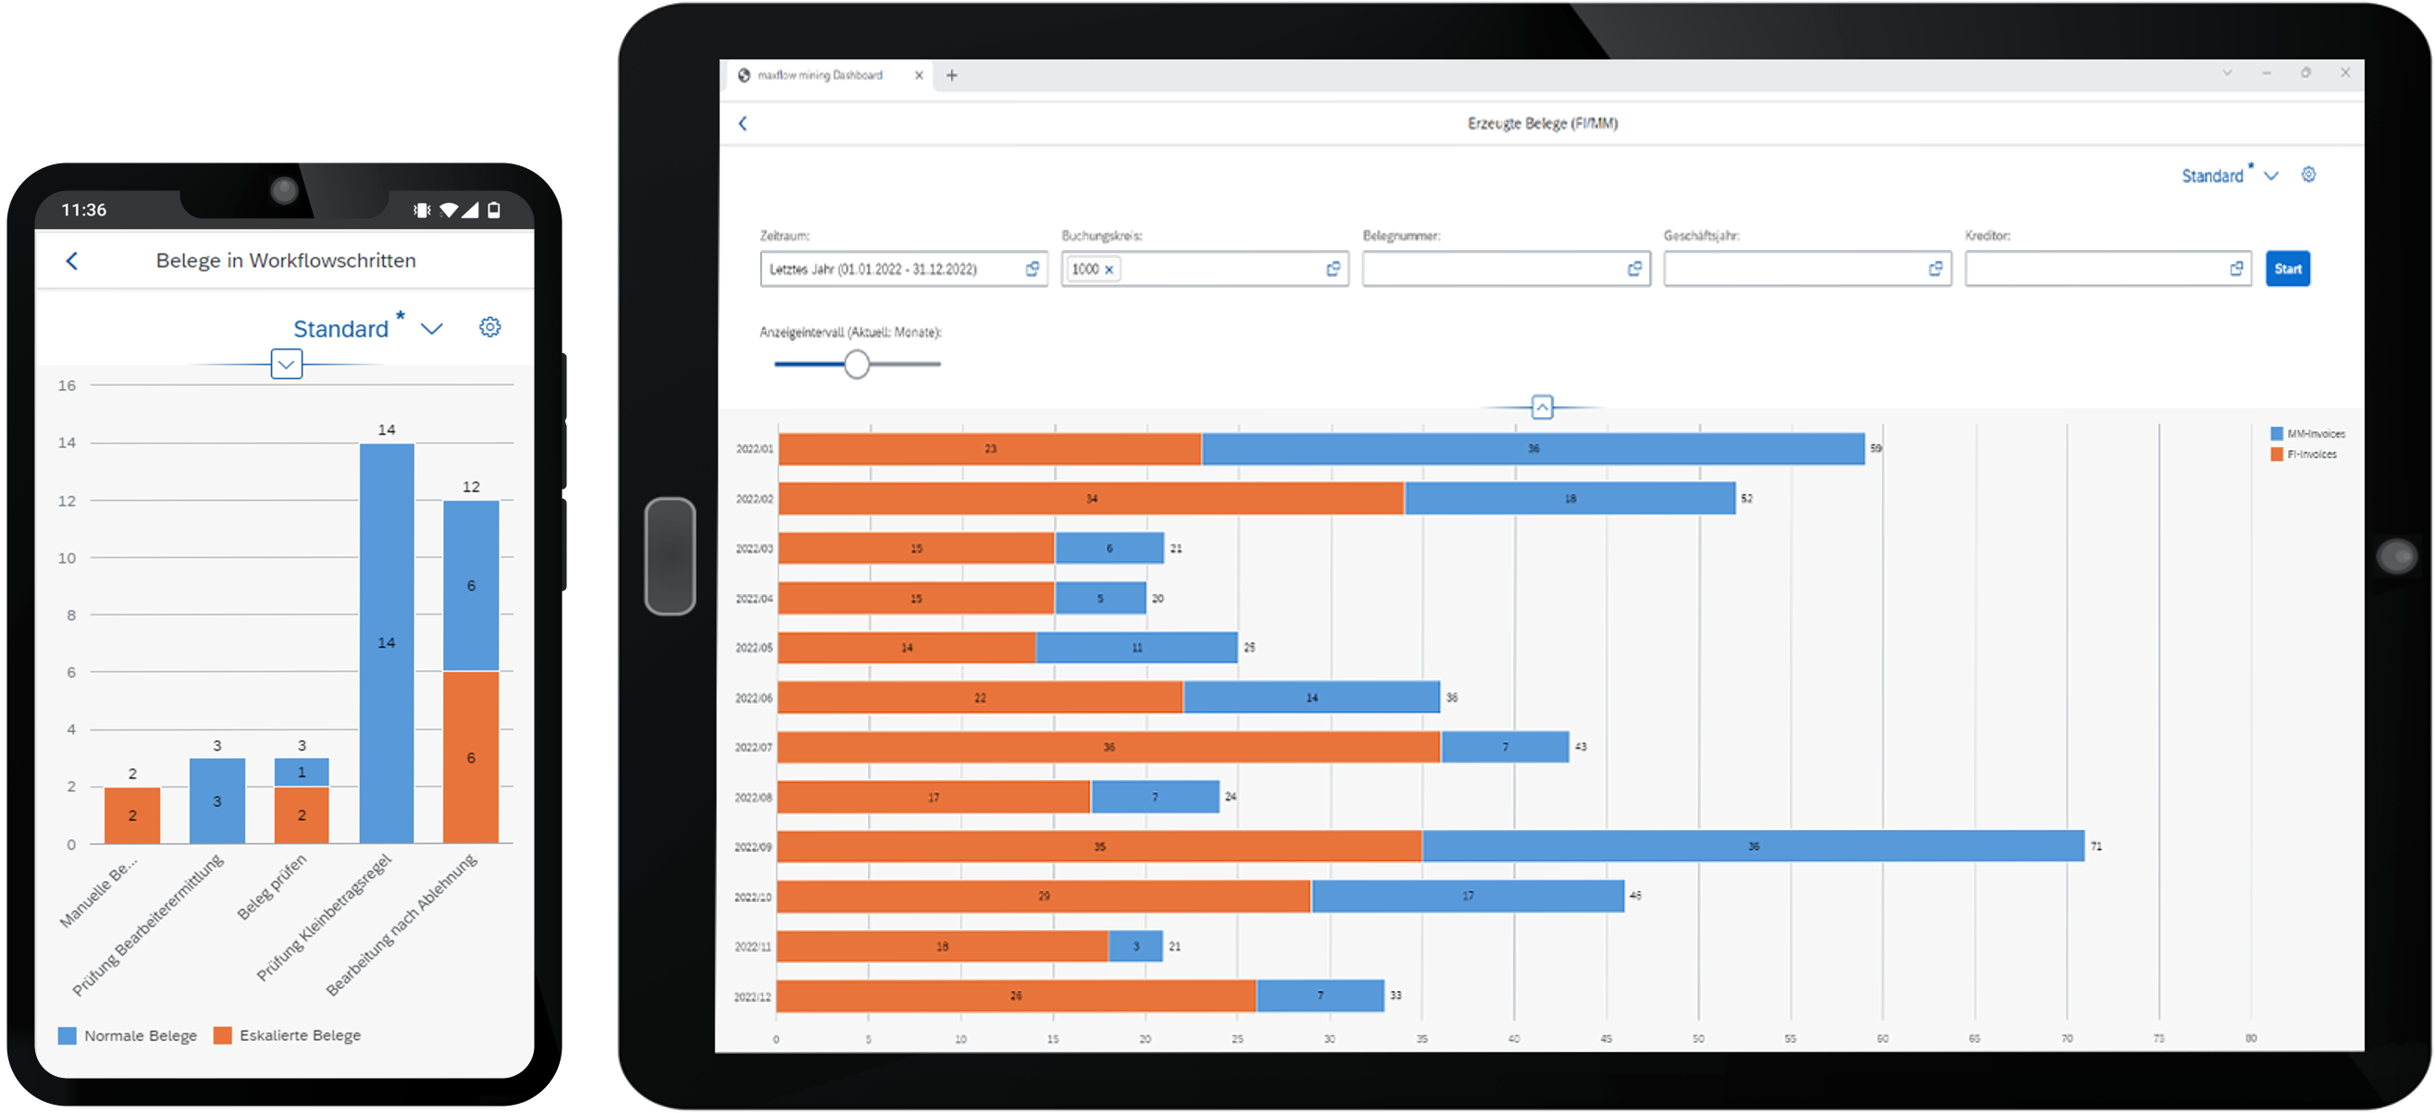
Evaluation of the Generated Documents
This evaluation displays the total number of documents generated for the selected period (quarters in the figure). When opening the tile, a stacked bar chart appears, which is divided by color into FI and MM documents. The display interval (days, weeks, months, quarters or years) and further selections (e.g. fiscal year or vendor) can be adjusted at any time as required. By clicking on the bar charts, the respective documents are listed with detailed information such as document number, amount and vendor.
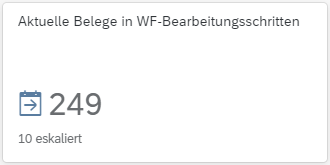
Evaluation of Documents in Workflow Steps
The documents with normal priority as well as the escalated documents are sorted in this analysis according to the respective workflow processing steps. The stacked bar chart, which opens when clicking on the tile, can be customized using various selections (e.g. workflow steps or time period). A list can also be called up here, which displays a detailed view of the documents (e.g. amount, vendor, company code, etc.) in the respective workflow step.
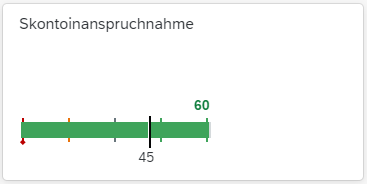
Evaluation of the Cash Discount Claim
The highest possible, as well as the actual amount of the claimed cash discount of the documents are compared with each other in this evaluation. 75% of the highest possible cash discount is specified as the target (45 in the figure). In addition, a line chart shows the cash discount utilization over time, whereby a detailed view with information on the cash discount utilization is also available here by clicking on the respective data point in the line chart. The display interval and other selections can also be set as desired.

Evaluation of suppliers ABC analysis
The ABC supplier analysis is a method for classifying and prioritizing suppliers based on their contribution to a company's value creation. In this evaluation, the share of the top 5 suppliers is analyzed based on an ABC classification. The percentage share of the top suppliers in the selected documents is calculated. The aim is to identify the dependency on the most important suppliers and to identify optimization potential in the supplier structure.

Evaluation of expected outgoing payments
The total displayed on the tile represents the expected outgoing payments of the documents that were determined on the basis of the previously defined selection criteria (e.g. date, supplier, amount, etc.). This total provides a quick overview of the financial scope of the pending payments and offers an important basis for decision-making for liquidity management. Clicking on the tile opens a graphical representation of the outgoing payments.
Our Reference Customers
Many well-known companies from various industries rely on our solutions.


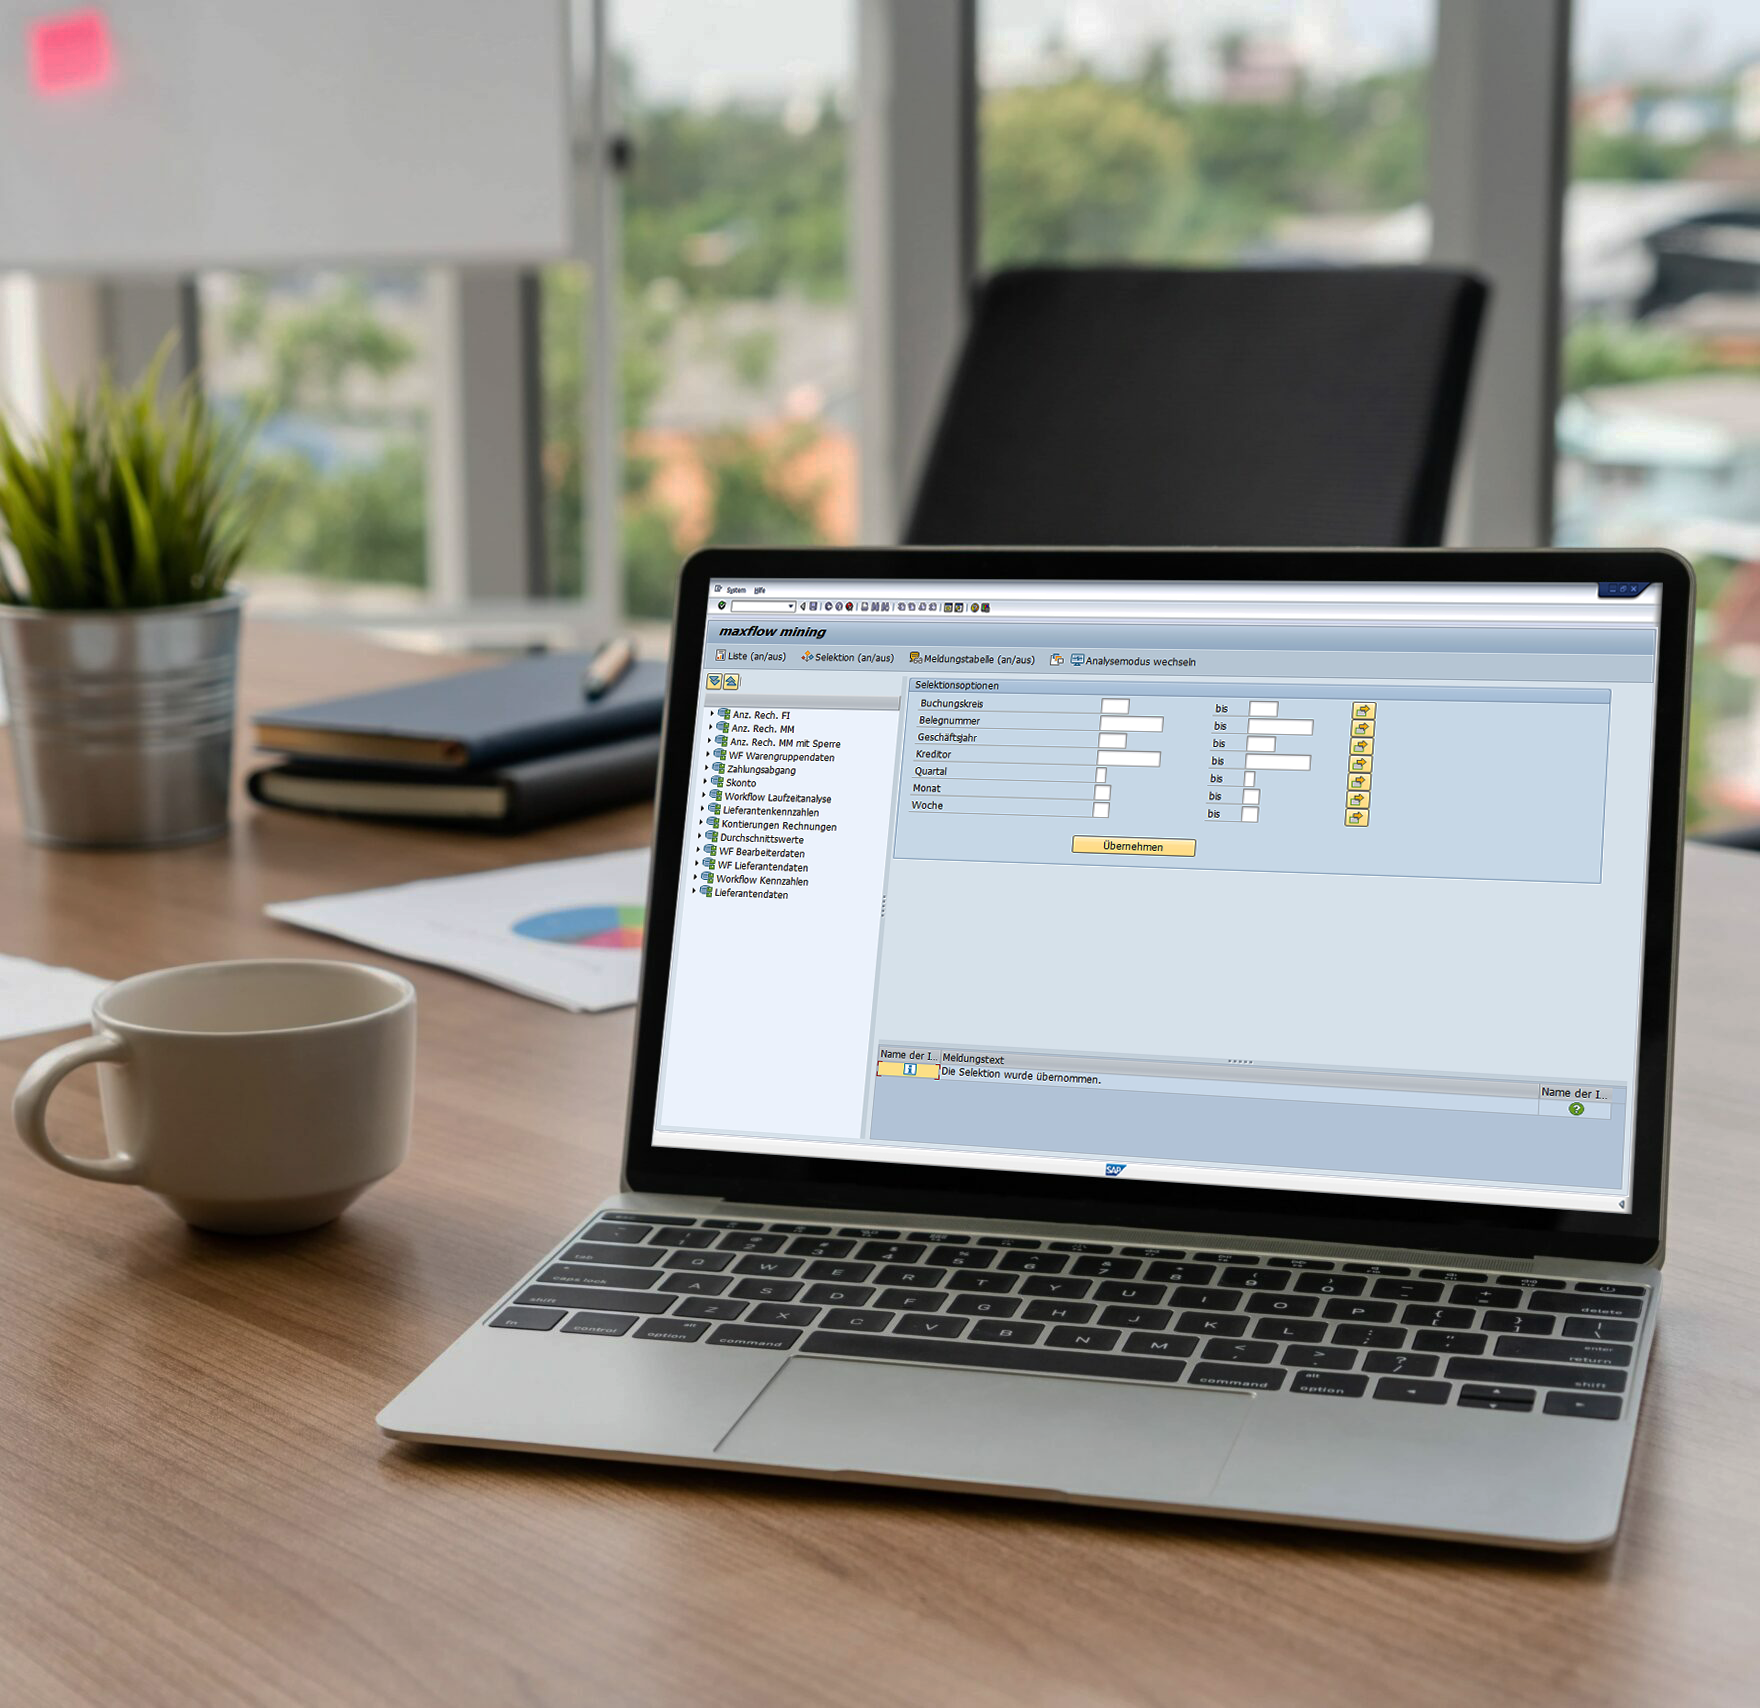
SAP Integrated Data Analysis of Processing Operations
In addition to evaluations of lead time behavior and discount utilization, month-end closing operations are also supported. Statistics, such as the achieved dark posting rate, show documents that have been posted in SAP after a text identification without any further processing step. In this way, the degree of automation of the processing procedures can be checked and optimized.
With the payment outflow analysis, concrete statements can be made for the documents in the workflow, e.g., in which amount at which time the payment outflow is to be expected.
maxflow® mining also enables a period-related (year, quarter, month, week) or organization-related (company code) display of the requested data in list formas well as in graphical form. The previously time-consuming compilation of overviews for any necessary accrual postings is now a thing of the past.